Stats plugin
The Tecs stats module provides a debug overlay that displays real-time performance metrics and system information, helping you monitor and optimize your game's performance. You install the plugin, and hit F1 to see the debug info.
Overview
The stats system shows performance data including:
- Frame rate (FPS)
- Memory usage (Lua and texture memory)
- Draw call statistics and batching efficiency
- ECS metrics (entities, components, systems, archetypes)
- Active archetype breakdown (optional)
Getting started
Add the stats plugin to your world to enable the debug overlay:
local tecs = require("tecs")
local tecs2d = require("tecs2d")
local stats = require("tecs2d.stats")

-- In your game plugin....
function gamePlugin(world)
    -- Add the stats plugin with default settings
    world:addPlugin(stats.newStatsPlugin())

    -- Your game systems...
end

-- Use with tecs2d.run
love.run = tecs2d.run({ fps = 60, game = gamePlugin })
Basic usage
Once installed, the stats overlay can be toggled between two modes:
- Off (default): No overlay visible
- On: Shows performance stats
Press F1 (the default binding) to toggle between these modes.
Configuration
Customize the stats plugin behavior with a configuration table:
local stats = require("tecs2d.stats")

local statsPlugin = stats.newStatsPlugin({
    -- Custom font for the overlay
    font = love.graphics.newFont(12),

    -- Key to toggle debug modes (default: "f1")
    keyBinding = "f1",

    -- Key to show/hide archetype breakdown (default: "f2")
    archetypeBinding = "f2",

    -- How often to update memory stats in seconds (default: 1)
    sampleFrequency = 1,

    -- How often to run garbage collection in seconds (default: 8)
    gcFrequency = 8
})

world:addPlugin(statsPlugin)
Displayed metrics
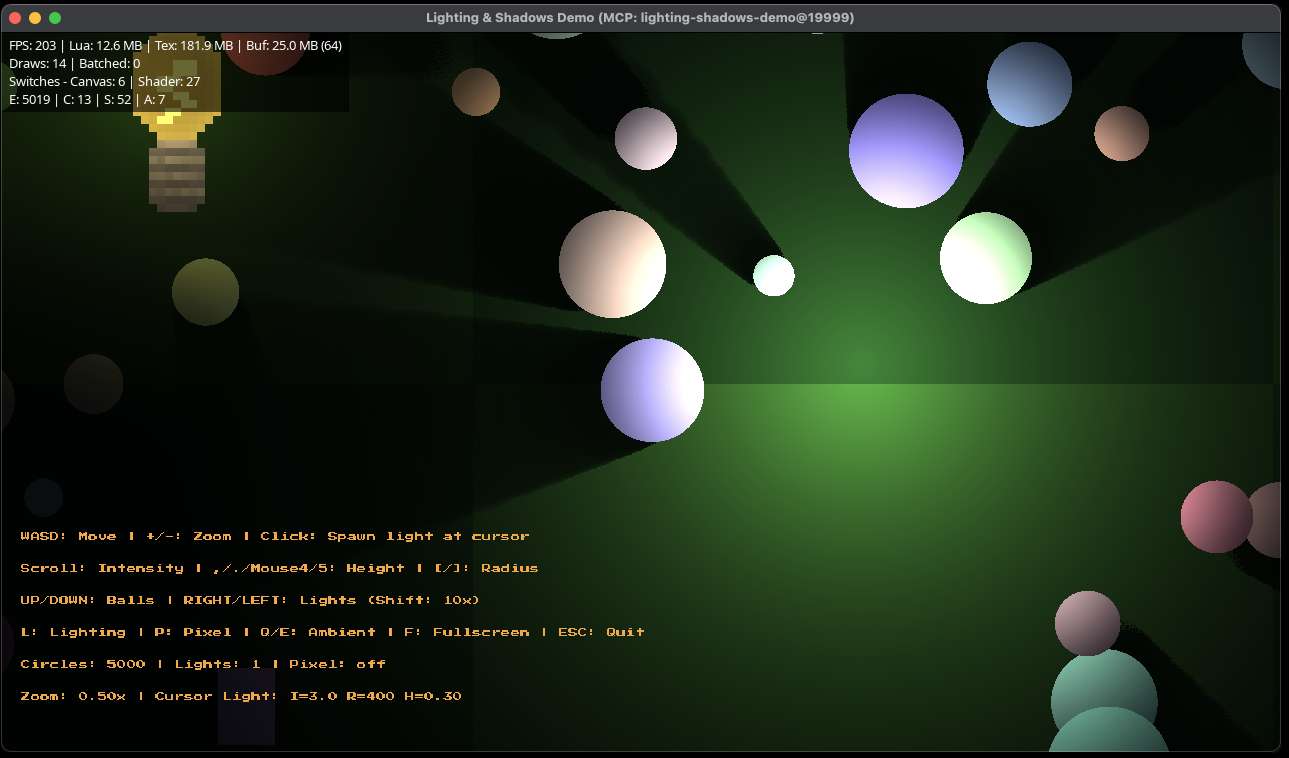
Performance metrics
The overlay displays the following information:
Frame rate
- FPS: Current frames per second
Memory usage
- Lua Memory: Current Lua heap memory usage in MB
- Texture Memory: GPU texture memory usage in MB
- Buffer Memory: GPU buffer memory usage in MB and buffer count
Rendering statistics
- Draws: Number of draw calls this frame
- Batched: Number of draw calls that were batched together
- Canvas Switches: Number of render target changes
- Shader Switches: Number of shader program changes
ECS statistics
- E: Total number of entities
- C: Number of registered component types in use
- S: Total number of systems
- A: Number of unique archetypes
Archetype breakdown
Press F2 (default) to toggle the archetype breakdown view, which shows:
- Each active archetype's component composition
- Number of entities in each archetype
Toggling the overlay
The overlay is toggled at runtime by the configured keys: keyBinding (F1 by default) shows or hides the stats, and archetypeBinding (F2 by default) toggles the archetype breakdown. The enabled state is held internally by the plugin; there is no separate programmatic API to read or set it.